A popular way to visualize the Bering Sea Rule is to utilize the maps @crankywxguy generates (http://www.stormhamster.com/bsr/bsr.php) which showcases daily surface and 500MB. I may just run with those metrics for the time being and concentrate on the "pattern" scoring 5-day anomalies.
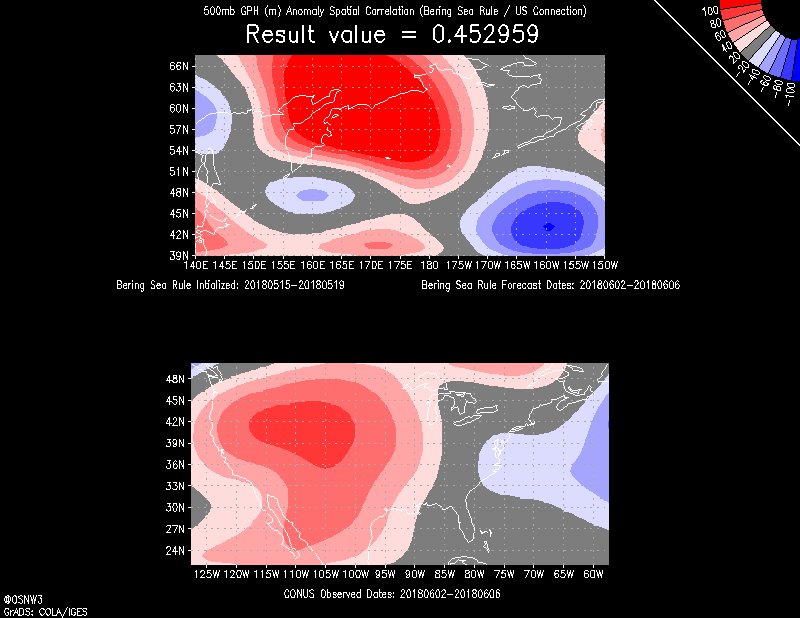
For those interested in the verification method; the verification data are generated from ESRL NetCDF files utilizing the scorr function within GrADS. A snippet of the GrADS script is below. Beware, my GrADS scripting is amatuer at best. Enjoy!
function script(args)
myVarA=subwrd(args,1)
myVarB=subwrd(args,2)
myVarC=subwrd(args,3)
myVarD=subwrd(args,4)
'reinit'
rc = gsfallow("on")
nrows=2
ncols=1
args=nrows%' '%ncols
'sdfopen Z:\VMSharedFolder\Projects\Verification\esrl-ncdeflect\'myVarC
'set mproj latlon'
panels(args)
p=1
_vpg.1
'set parea 1 9.8 1 7.5'
'set t 1'
'set grads off'
'set gxout shaded'
'set rgb 16 0 0 255'
'set rgb 17 55 55 255'
'set rgb 18 110 110 255'
'set rgb 19 165 165 255'
'set rgb 20 220 220 255'
'set rgb 21 255 220 220'
'set rgb 22 255 165 165'
'set rgb 23 255 110 110'
'set rgb 24 255 55 55'
'set rgb 25 255 0 0'
'set rgb 26 255 250 250'
'set rgb 27 125 125 125'
'set clevs -100 -80 -60 -40 -20 20 40 60 80 100'
'set ccols 16 17 18 19 20 27 21 22 23 24 25'
'set lon 140 210'
'set lat 39 65'
'set frame off'
'set mpdraw on'
'set gxout shaded'
'set csmooth on'
'd hgt1'
'd scorr(hgt1,hgt2,lon=0,lon=75,lat=57.5,lat=90)'
myVar=result
'run cbarc.gs'
'draw string 1.6 .35 Bering Sea Rule Intialized: 'myVarB
'draw string 5.8 .35 Bering Sea Rule Forecast Dates: 'myVarA
'draw string 2.8 4.12 500mb GPH (m) Anomaly Spatial Correlation (Bering Sea to CONUS Teleconnection)'
'draw title 'myVar
p=2
_vpg.2
'set parea 1 9.8 1 7.5'
'set t 1'
'set grads on'
'set gxout shaded'
'set rgb 16 0 0 255'
'set rgb 17 55 55 255'
'set rgb 18 110 110 255'
'set rgb 19 165 165 255'
'set rgb 20 220 220 255'
'set rgb 21 255 220 220'
'set rgb 22 255 165 165'
'set rgb 23 255 110 110'
'set rgb 24 255 55 55'
'set rgb 25 255 0 0'
'set rgb 26 255 250 250'
'set rgb 27 125 125 125'
'set clevs -100 -80 -60 -40 -20 20 40 60 80 100'
'set ccols 16 17 18 19 20 27 21 22 23 24 25'
'set lon 232.5 302.5'
'set lat 24.5 50'
'set frame off'
'set mpdraw on'
'set gxout shaded'
'set csmooth on'
'd hgt2'
'draw string 3.9 .35 CONUS Observed Dates: 'myVarA
'draw string 0.05 .27 @OSNW3'
'set vpage off'
'printim Z:\VMSharedFolder\Projects\Verification\result-images\'myVarD
'set gxout print'
'set prnopts %6.2f'
write('bsr-hgt.txt', myVarB' 'myVar, append)
;
Also, there is some pre-GrADS NetCDF magic to line up the two domains for use with the scorr function. If there are any questions, comments, or suggestions on the material presented please let me know. Thank you for reading.