Forecast Model
I have created an ensemble consisting of three members and a mean in hopes of enhancing model accuracy this season. In past seasons I have just used a full blend.
Member 1 (M1) – Full blend of cycles
Member 2 (M2) – Weighted blend of cycles
Member 3 (M3) – Bering Sea Rule
Ensemble Mean (Mean) – Weighted result of the Members
If more information on each of the members is needed feel free to contact me. I would be happy to explain them in further detail. >> More
Forecast Visualization
I have gone from using images to interactive data visualizations this season. Thanks goes out to Scott Metsker for helping me realize it is doable and to Google Viz for making it easy.
Station Visualization
.Charts
--I have configured a four panel chart for the 2013-14 season. The top two charts depict forecast max temperature and min temperature. The bottom two charts depict forecast precipitation and snow. Precipitation is charted 0-100% chance. If precipitation was observed at the station a tick mark will appear for that day at the bottom of the chart. Snow is in a plume format showing each member and mean forecast snowfall output in inches.
--The charts are controlled by changing the date range on the slider below the fourth chart. It can be slid back and forth, extended and trimmed. Default range is the current cycle length. Mouse over the chart data for a tool tip of daily forecast data. The API takes less than 30 seconds to load. If it times out, refresh the page. If in a hurry, just click on the Excel Interactive View above for a table of the daily data.
.Tables
--I have configured a list for the three member ensemble Mean forecast values for a month and season. The table shows max temperature, min temperature, precipitation, snow, and days with snow forecasts for an entire month and season. Also listed is the station average for the season. Observed values are updated at the end of a season.
Regional Visualization
.Maps
--Max temperature departure from average is mapped in semi monthly increments. The time frame can be selected by using the drop down list in the upper left corner of the map frame. The map data can be viewed by scrolling over the dot.
--I am also mapping and listing total precipitation, snowfall total, and days with measurable snowfall. The time frame can be selected by clicking the desired month or season from the links on the left side of the page. The map data can be viewed by scrolling over the dot. The table can be sorted by category by clicking on the column header.
.Charts
--I have configured motion charts for daily max temperature departures from average for each station. The motion chart gives several different ways to view the data. The motion chart is configured to default in the bar graph format. Use the tabs in the upper right hand corner of the chart to change the chart type. The color of the data in the chart can be changed, along with both the x and y axis value. Clicking the play button puts the data in motion. The time frame for a chart can be selected by clicking the desired month or season from the links on the left side of the page
--I am also charting a cyclic view of the AO, NAO, and PNA teleconnection along with the Bering Sea Rule and Typhoon Rule.
If there are any questions, comments, or suggestions please let me know. Thanks for reading! The site in reference can be found by clicking here.
Oct 17, 2013
Bering Sea Rule & Typhoon Rule
Experimenting with the BSR and TR to find a medium range Midwest temperature trend. I took the easy route to put this together. Using Joseph Renken's explanation of the rules I simply laid it out as a control loop. My process variable is the Midwest mean temperature. My setpoint is the surface data from the specified regions. My control variable is the correlation days. Stuff it together any way you'd like I suppose.
My application of both the BSR and TR is a retrofit. What I am correlating isn't the BSR or TR technically. The regions in comparison are the western shores of the Bering Sea for the BSR and Japan for the TR. For the BSR/TR charts, I kept the M1, M2, M3 moniker of my station trends for consistency. Each "member" is a different observation station in that region.
BSR currently uses
Member 1 (M1) – UHMA
Member 2 (M2) – UHMM
Member 3 (M3) – UHPP
TR currently uses
Member 1 (M1) – RJTT
Member 2 (M2) – RJOH
Member 3 (M3) – RJSI
The BSR/TR chart is based on MaxT. The Midwest Mean is currently the MaxT anomaly for the stations list below. If there are suggestions on which stations to include or exclude I am open to them! MSP, DSM, COU, CMI, MSN, ARB, DAY, LNK, FSD, FAR. All this is preliminary work and subject to change.
Bering Sea Rule

Charts

If there are any questions or thoughts on my research and analysis of the BSR and TR or how I presented the material just let me know in the comments section of the blog. Thanks for reading!
My application of both the BSR and TR is a retrofit. What I am correlating isn't the BSR or TR technically. The regions in comparison are the western shores of the Bering Sea for the BSR and Japan for the TR. For the BSR/TR charts, I kept the M1, M2, M3 moniker of my station trends for consistency. Each "member" is a different observation station in that region.
BSR currently uses
Member 1 (M1) – UHMA
Member 2 (M2) – UHMM
Member 3 (M3) – UHPP
TR currently uses
Member 1 (M1) – RJTT
Member 2 (M2) – RJOH
Member 3 (M3) – RJSI
The BSR/TR chart is based on MaxT. The Midwest Mean is currently the MaxT anomaly for the stations list below. If there are suggestions on which stations to include or exclude I am open to them! MSP, DSM, COU, CMI, MSN, ARB, DAY, LNK, FSD, FAR. All this is preliminary work and subject to change.
Bering Sea Rule

Charts
If there are any questions or thoughts on my research and analysis of the BSR and TR or how I presented the material just let me know in the comments section of the blog. Thanks for reading!
Oct 14, 2013
For the Next Month...
I miss calculated the date of full initialization. It is not NOV 17, it is the run of NOV 18. So, the morning of NOV 19, precipitation and snow predictions will be official.
I am in BETA mode with the site and data visualizations. Fixing bugs and what not as I test. As it is with my coding sometimes, I fix one thing, that thing then brakes something else. LOL. Feel free to participate, run the site and API's through the ringer.
The OSNW3 LRC/ISO/BSR correlations are in genesis stage. In past years, I had not made the data live until the algorithms had locked in. This year I decided to let people watch the patterns/cycle evolve. What you are seeing right now is just a fraction of the patterns that will make up the entire cycle. By mid November each station will have enough data to project through next September.
Because of it being so early in the cyclic pattern genesis, the range selector is offset off the chart, to get around that take the left marker and move to the right, then you'll get the range of half the current cycle duration. Don't forget about the Excel Interactive View. It is all the ensemble data for that station at your finger tips! I have password protected the Excel Interactive View data this year. If you would like access to the ensemble data shoot me an email to get a username and password.
If you find yourself on the site and see something that totally sucks, please let me know!
Lots to do yet @dlhmnwx30 but it's never too early to see WTF is going on with the model. LOL. #OSNW3 #LRC #ISO #BSR pic.twitter.com/EYAwb8qdmV
— Josh Herman (@OSNW3) October 11, 2013
Oct 13, 2013
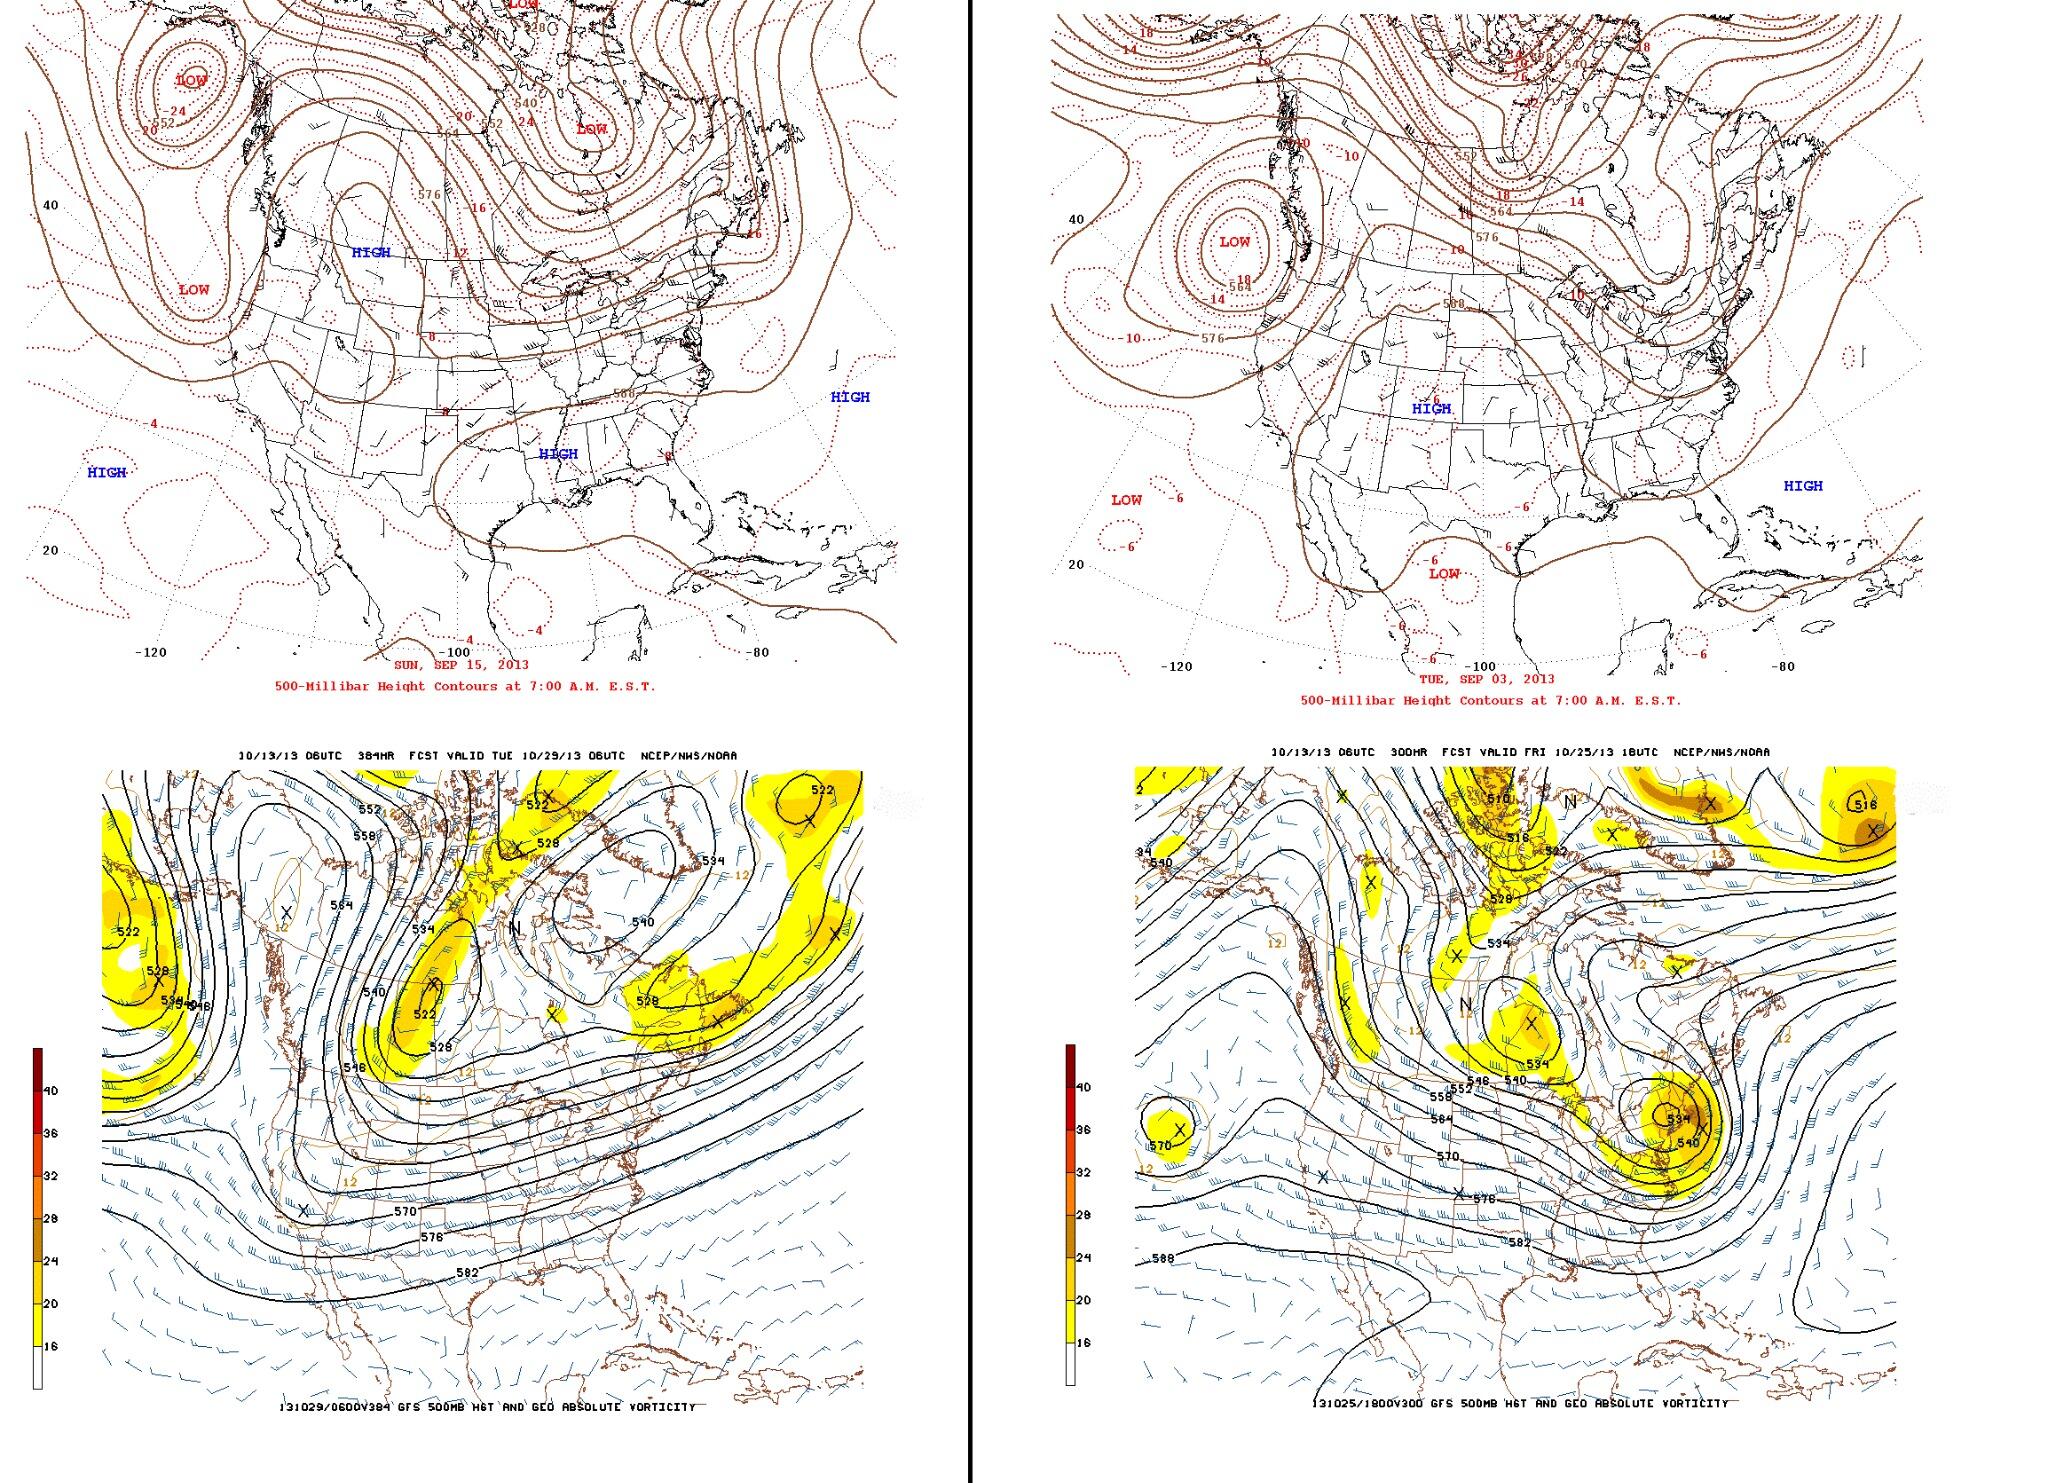
Long Range GFS Picking Up On Previous Patterns
Obviously too far out to choose dates, but we know that the LR GFS is usually a few days early. I will revisit this comparison in two weeks.
If there are any questions or thoughts on my research and analysis of the LRC or how I presented the material just let me know in the comments section of the blog. Thanks for reading!
If there are any questions or thoughts on my research and analysis of the LRC or how I presented the material just let me know in the comments section of the blog. Thanks for reading!
Oct 7, 2013
Bering Sea Rule With The Assist?
#beringsearule #typhoonrule
Hello everyone,
This is Joe Renken of KOPN Weather bringing you the weekly long range discussion for the KOPN listening area. The tropical system that we talked about last week was delayed from development by a couple of days, and as such…the result is a delay with the rest of the forecast. We still have a sizeable trough over East Asia showing up from the 9th-12th which translates to a trough over our area between the 15th and 22nd with a quick ridging to follow. Then, a more sizeable trough follows immediately which translates to the cooler period between the 20th and 26th. Zonal flow then sets up which means the warm up will be slow afterwards.
In the Bering Sea, a sizeable system is showing up between the 8th and 14th which continues to show a cool end to the month and into November before a quick ridge shows up mid-month of October. This will translate to ridging in the middle of the first week of November.
---
My take:
Translate JD's second paragraph - (from JD: "end to the month and into November") into LRC. I take the end of the period, November 2nd, subtract 43 days (potential 43 day cycle mention), I get September 20th.
(Sep 20, 2013)

To start (click the image if you want to play along), I go forward, I see ridging showing up 9/20-26 (from JD: "ridging in the middle of the first week of November"), and when I go backward I see a *parade of troughs 9/12-20 (from JD: "In the Bering Sea, a sizeable system is showing up between the 8th and 14th").
*Instead of mentioning just one system as JD does (from JD: "a sizeable system is showing up between the 8th and 14th") I'd like to mention, I see multiple systems of different strength. But I am using NOGAPS. :)
43 day cycle length or is this just a 3/4 harmonic of 57?
Bering Sea Rule With The Assist?
If there are any questions or thoughts on my research and analysis of the LRC and BSR or how I presented the material just let me know in the comments section of the blog. Thanks for reading!
Hello everyone,
This is Joe Renken of KOPN Weather bringing you the weekly long range discussion for the KOPN listening area. The tropical system that we talked about last week was delayed from development by a couple of days, and as such…the result is a delay with the rest of the forecast. We still have a sizeable trough over East Asia showing up from the 9th-12th which translates to a trough over our area between the 15th and 22nd with a quick ridging to follow. Then, a more sizeable trough follows immediately which translates to the cooler period between the 20th and 26th. Zonal flow then sets up which means the warm up will be slow afterwards.
In the Bering Sea, a sizeable system is showing up between the 8th and 14th which continues to show a cool end to the month and into November before a quick ridge shows up mid-month of October. This will translate to ridging in the middle of the first week of November.
---
My take:
Translate JD's second paragraph - (from JD: "end to the month and into November") into LRC. I take the end of the period, November 2nd, subtract 43 days (potential 43 day cycle mention), I get September 20th.
(Sep 20, 2013)
To start (click the image if you want to play along), I go forward, I see ridging showing up 9/20-26 (from JD: "ridging in the middle of the first week of November"), and when I go backward I see a *parade of troughs 9/12-20 (from JD: "In the Bering Sea, a sizeable system is showing up between the 8th and 14th").
*Instead of mentioning just one system as JD does (from JD: "a sizeable system is showing up between the 8th and 14th") I'd like to mention, I see multiple systems of different strength. But I am using NOGAPS. :)
43 day cycle length or is this just a 3/4 harmonic of 57?
Bering Sea Rule With The Assist?
If there are any questions or thoughts on my research and analysis of the LRC and BSR or how I presented the material just let me know in the comments section of the blog. Thanks for reading!
Subscribe to:
Posts (Atom)