Nov 29, 2013

Map Comparisons...

For the data impaired. A snap shot in time.


----

And then there is this map. I hate doing this, because there is more to it, but it's not a coincidence these maps look similar. The cycle is at ~57 and long range models are always a couple days quick.


If there are any questions, comments, or suggestions please let me know. Thanks for reading!

Nov 18, 2013

OSNW3|WxClimate Trends 2013-14

Consider the Rossby Wave, a wave train carrying with it repeating intervals of atmospheric conditions.

Rossby Wave


2013-14 marks the fourth year that I have been following the recurring long term long wave troughs and ridges. Since my first days of learning of them from Jeremy Nelson, with the likes of Gary LezakDoug Heady, and the AccuWx Forum crew, my curiosity piqued. To make this story short, I am still here, but now I am looking at this LRC stuff with hopes of forming a reliable point of view.

Reconsider the basics of LRC. Two of the main points can be described well with the opening statement of this blog entry.

* Long term long-wave troughs and ridges become established and also repeat at regular times within the cycle. These dominant repeating features are a clue to where storm systems will reach peak strength, and where they will be their weakest.
* The LRC isn’t just one long-wave trough, storm system, or ridge. It is a sequence of troughs and ridges that are cycling across the Northern Hemisphere.


But, it is these last two that cause confusion and are a hurdle.

* This unique weather pattern sets up every year between October and November
* The weather pattern cycles, repeats, and continues through winter, spring and into summer.

It was Scott Metsker, an advocate of critical thinking, who turned me onto looking at the cyclic patterns with a more focused, data driven, scientific approach. I was introduced to Intraseasonal Oscillations, Boreal Summer Monsoons, Northward Propagation Mechanisms, Rossby Waves, Standing Wave Harmonics, etc. These items soon became embedded into my daily operational thoughts of the cyclic patterns.

How do I get over this hurdle of when the weather pattern sets up? How does this annual unique cycling weather pattern come to life? A simple answer can be obtained by connecting the dots mentioned above. Choosing the correct source material will open a mind blowing path to "organic forecasting" based on the planets cyclic atmospheric behavior.

But, before I ever got to the hurdle, I attempted to prove that the first couple points could be utilized to project weather and climate conditions. The last two years I have developed a 'model', which is the main point to this entry, that attempts to forecast temperature and precipitation weeks and months into the future. My equations are simple and the 2013-14 version is ready to be tested and reviewed. I am looking forward to the results, no matter the outcome.

If there are any questions, comments, or suggestions please let me know. Thanks for reading!


Nov 5, 2013

Super Bowl XLVIII Weather Forecast

The headline "Super Bowl 2014: Farmers' Almanac Predicts Winter Storm for Northeast in Time for Game" is fun and exciting for storm enthusiasts. Unfortunately using the long range forecasting methods that I do, my headline is not as appealing as "Storm Bowl". One thing is obvious, the day will live up to the hype "THE FIRST OUTDOOR, COLD WEATHER SUPER BOWL". With the cycle duration at ~57 days this year, the pattern that surrounded October 11th is a point in time to key on. More data comes in for the February 2nd date around December 7th.

New York, NY Forecast Chart


New York, NY Forecast Table


October 11, 2012 Daily Wx Map


Update

Oct 21, 2013

New Additions to the WxClimate Website in 2013-14

Forecast Model
I have created an ensemble consisting of three members and a mean in hopes of enhancing model accuracy this season. In past seasons I have just used a full blend.

Member 1 (M1) – Full blend of cycles
Member 2 (M2) – Weighted blend of cycles
Member 3 (M3) – Bering Sea Rule
Ensemble Mean (Mean) – Weighted result of the Members

If more information on each of the members is needed feel free to contact me. I would be happy to explain them in further detail. >> More

Forecast Visualization
I have gone from using images to interactive data visualizations this season. Thanks goes out to Scott Metsker for helping me realize it is doable and to Google Viz for making it easy.

Station Visualization
.Charts
--I have configured a four panel chart for the 2013-14 season. The top two charts depict forecast max temperature and min temperature. The bottom two charts depict forecast precipitation and snow. Precipitation is charted 0-100% chance. If precipitation was observed at the station a tick mark will appear for that day at the bottom of the chart. Snow is in a plume format showing each member and mean forecast snowfall output in inches.
--The charts are controlled by changing the date range on the slider below the fourth chart. It can be slid back and forth, extended and trimmed. Default range is the current cycle length. Mouse over the chart data for a tool tip of daily forecast data. The API takes less than 30 seconds to load. If it times out, refresh the page. If in a hurry, just click on the Excel Interactive View above for a table of the daily data.

.Tables
--I have configured a list for the three member ensemble Mean forecast values for a month and season. The table shows max temperature, min temperature, precipitation, snow, and days with snow forecasts for an entire month and season. Also listed is the station average for the season. Observed values are updated at the end of a season.

Regional Visualization
.Maps
--Max temperature departure from average is mapped in semi monthly increments. The time frame can be selected by using the drop down list in the upper left corner of the map frame. The map data can be viewed by scrolling over the dot.
--I am also mapping and listing total precipitation, snowfall total, and days with measurable snowfall. The time frame can be selected by clicking the desired month or season from the links on the left side of the page. The map data can be viewed by scrolling over the dot. The table can be sorted by category by clicking on the column header.

.Charts
--I have configured motion charts for daily max temperature departures from average for each station. The motion chart gives several different ways to view the data. The motion chart is configured to default in the bar graph format. Use the tabs in the upper right hand corner of the chart to change the chart type. The color of the data in the chart can be changed, along with both the x and y axis value. Clicking the play button puts the data in motion. The time frame for a chart can be selected by clicking the desired month or season from the links on the left side of the page
--I am also charting a cyclic view of the AO, NAO, and PNA teleconnection along with the Bering Sea Rule and Typhoon Rule.

If there are any questions, comments, or suggestions please let me know. Thanks for reading! The site in reference can be found by clicking here.

Oct 17, 2013

Bering Sea Rule & Typhoon Rule

Experimenting with the BSR and TR to find a medium range Midwest temperature trend. I took the easy route to put this together. Using Joseph Renken's explanation of the rules I simply laid it out as a control loop. My process variable is the Midwest mean temperature. My setpoint is the surface data from the specified regions. My control variable is the correlation days. Stuff it together any way you'd like I suppose.

My application of both the BSR and TR is a retrofit. What I am correlating isn't the BSR or TR technically. The regions in comparison are the western shores of the Bering Sea for the BSR and Japan for the TR. For the BSR/TR charts, I kept the M1, M2, M3 moniker of my station trends for consistency. Each "member" is a different observation station in that region.

BSR currently uses
Member 1 (M1) – UHMA
Member 2 (M2) – UHMM
Member 3 (M3) – UHPP

TR currently uses
Member 1 (M1) – RJTT
Member 2 (M2) – RJOH
Member 3 (M3) – RJSI

The BSR/TR chart is based on MaxT. The Midwest Mean is currently the MaxT anomaly for the stations list below. If there are suggestions on which stations to include or exclude I am open to them! MSP, DSM, COU, CMI, MSN, ARB, DAY, LNK, FSD, FAR. All this is preliminary work and subject to change.

Bering Sea Rule


Charts


If there are any questions or thoughts on my research and analysis of the BSR and TR or how I presented the material just let me know in the comments section of the blog. Thanks for reading!

Oct 14, 2013

For the Next Month...

I miss calculated the date of full initialization. It is not NOV 17, it is the run of NOV 18. So, the morning of NOV 19, precipitation and snow predictions will be official.

I am in BETA mode with the site and data visualizations. Fixing bugs and what not as I test. As it is with my coding sometimes, I fix one thing, that thing then brakes something else. LOL. Feel free to participate, run the site and API's through the ringer.

The OSNW3 LRC/ISO/BSR correlations are in genesis stage. In past years, I had not made the data live until the algorithms had locked in. This year I decided to let people watch the patterns/cycle evolve. What you are seeing right now is just a fraction of the patterns that will make up the entire cycle. By mid November each station will have enough data to project through next September.

Because of it being so early in the cyclic pattern genesis, the range selector is offset off the chart, to get around that take the left marker and move to the right, then you'll get the range of half the current cycle duration. Don't forget about the Excel Interactive View. It is all the ensemble data for that station at your finger tips! I have password protected the Excel Interactive View data this year. If you would like access to the ensemble data shoot me an email to get a username and password.

If you find yourself on the site and see something that totally sucks, please let me know!


Oct 13, 2013

Long Range GFS Picking Up On Previous Patterns

Obviously too far out to choose dates, but we know that the LR GFS is usually a few days early. I will revisit this comparison in two weeks.


If there are any questions or thoughts on my research and analysis of the LRC or how I presented the material just let me know in the comments section of the blog. Thanks for reading!

Oct 7, 2013

Bering Sea Rule With The Assist?

#beringsearule #typhoonrule

Hello everyone,


This is Joe Renken of KOPN Weather bringing you the weekly long range discussion for the KOPN listening area. The tropical system that we talked about last week was delayed from development by a couple of days, and as such…the result is a delay with the rest of the forecast. We still have a sizeable trough over East Asia showing up from the 9th-12th which translates to a trough over our area between the 15th and 22nd with a quick ridging to follow. Then, a more sizeable trough follows immediately which translates to the cooler period between the 20th and 26th. Zonal flow then sets up which means the warm up will be slow afterwards.


In the Bering Sea, a sizeable system is showing up between the 8th and 14th which continues to show a cool end to the month and into November before a quick ridge shows up mid-month of October. This will translate to ridging in the middle of the first week of November.


---

My take:
Translate JD's second paragraph - (from JD: "end to the month and into November") into LRC. I take the end of the period, November 2nd, subtract 43 days (potential 43 day cycle mention), I get September 20th.

(Sep 20, 2013)


To start (click the image if you want to play along), I go forward, I see ridging showing up 9/20-26 (from JD: "ridging in the middle of the first week of November"), and when I go backward I see a *parade of troughs 9/12-20 (from JD: "In the Bering Sea, a sizeable system is showing up between the 8th and 14th").

*Instead of mentioning just one system as JD does (from JD: "a sizeable system is showing up between the 8th and 14th") I'd like to mention, I see multiple systems of different strength. But I am using NOGAPS. :)

43 day cycle length or is this just a 3/4 harmonic of 57?

Bering Sea Rule With The Assist?

If there are any questions or thoughts on my research and analysis of the LRC and BSR or how I presented the material just let me know in the comments section of the blog. Thanks for reading!

Sep 21, 2013

No Maps! (And More)

The Tele images below are now interactive on the Internet but still under construction.

In this post I suggested a 43 day cycle. Perhaps a 3/4 harmonic with a potential 57 day cycle. No maps this time, just tele and sounding data. NAO and AO are around 57 ish days, and 500MB soundings from a northern location like International Falls, MN is around 44 ish days. Still hanging out at what I thought back in middle August, sorta. Note that the NAO/AO data is through 8/31 and the sounding data is through 9/21.

NAO/AO


500MB


AND then there is this.

"It's all a process. It's one thing to see patterns. It's another to apply another set of learning to determine impact." - Scott Metsker

Indeed. We have to give credit to SM for that quote. What can I learn from last year? Take the two maps below for an example. Let me remind myself, in mid September, while some/most of the patterns may have been established the cycle length had not.

(Sep-13-2012)


98 days later.

(Dec-20-2012)


I remember Dec-20 in the Midwest!

So I offer this GFS projection (Sep-29-2013).


I wish I were confident on a cycle length. LOL.

If there are any questions or thoughts on my research and analysis of the LRC or how I presented the material just let me know in the comments section of the blog. Thanks for reading!

Sep 14, 2013

The 2013-14 Cycle - From The OSNW3 Perspective

Looking for the "transition" cycle once again. How far back should I go? Glimpses early on. I am seeing 47 ish days.

(Jun-8)


(Jul-27)


(Sep-12)


We are close the finding the patterns that will be the cycle of 2013-14. Allowing the patterns to evolve with the season (patience) will harbor a definite and accurate long range forecast probability. I will keep this entry updated. Click here for last years attempt.

If there are any questions or thoughts on my research and analysis of the LRC or how I presented the material just let me know in the comments section of the blog. Thanks for reading!

Sep 2, 2013

Map Comparison! 12-13 Holding Strong? 13-14 Morphing?

The 2012-13 cycle. 52 ish days.

Aug-31


Jul-9


Waiting patiently, but then there is this...

Aug-21


3/4 harmonic? 43 days? Full cycle 57 days? LOL. We'll see!

Jul 26, 2013

Current Pattern - Never a Doubt?

It's getting chilly out side. People are talking about it. Never a doubt, since November? I think so.


Larger images --> Maps & Calendar
Reminder: this is why map comparisons are a cancer...

Jul 20, 2013

Enhancing the Full Blend?

After three years of following ‪LRC‬ patterns, I have come into a lower confidence in a "full blend" when projecting surface temps - http://tiny.cc/osnw3wxclimate. To enhance the model's long range temp accuracy, I've been creating an ‪ISO‬ LRC ensemble. KOSH is my guinea pig. When using ISO LRC to project long range weather conditions it is necessary to "give or take a day or two". The atmosphere is fluid after all. The model provides daily verification. More warm temperatures in ‪‎Oshkosh‬ as August begins? (see image) Interactive charts - http://tiny.cc/koshens and a remainder of summer forecast based on LRC "full blend" - http://tiny.cc/wiwxjulaug

Jul 6, 2013

Predicting Future Weather Using Unproven Ideas and Other Voodoo

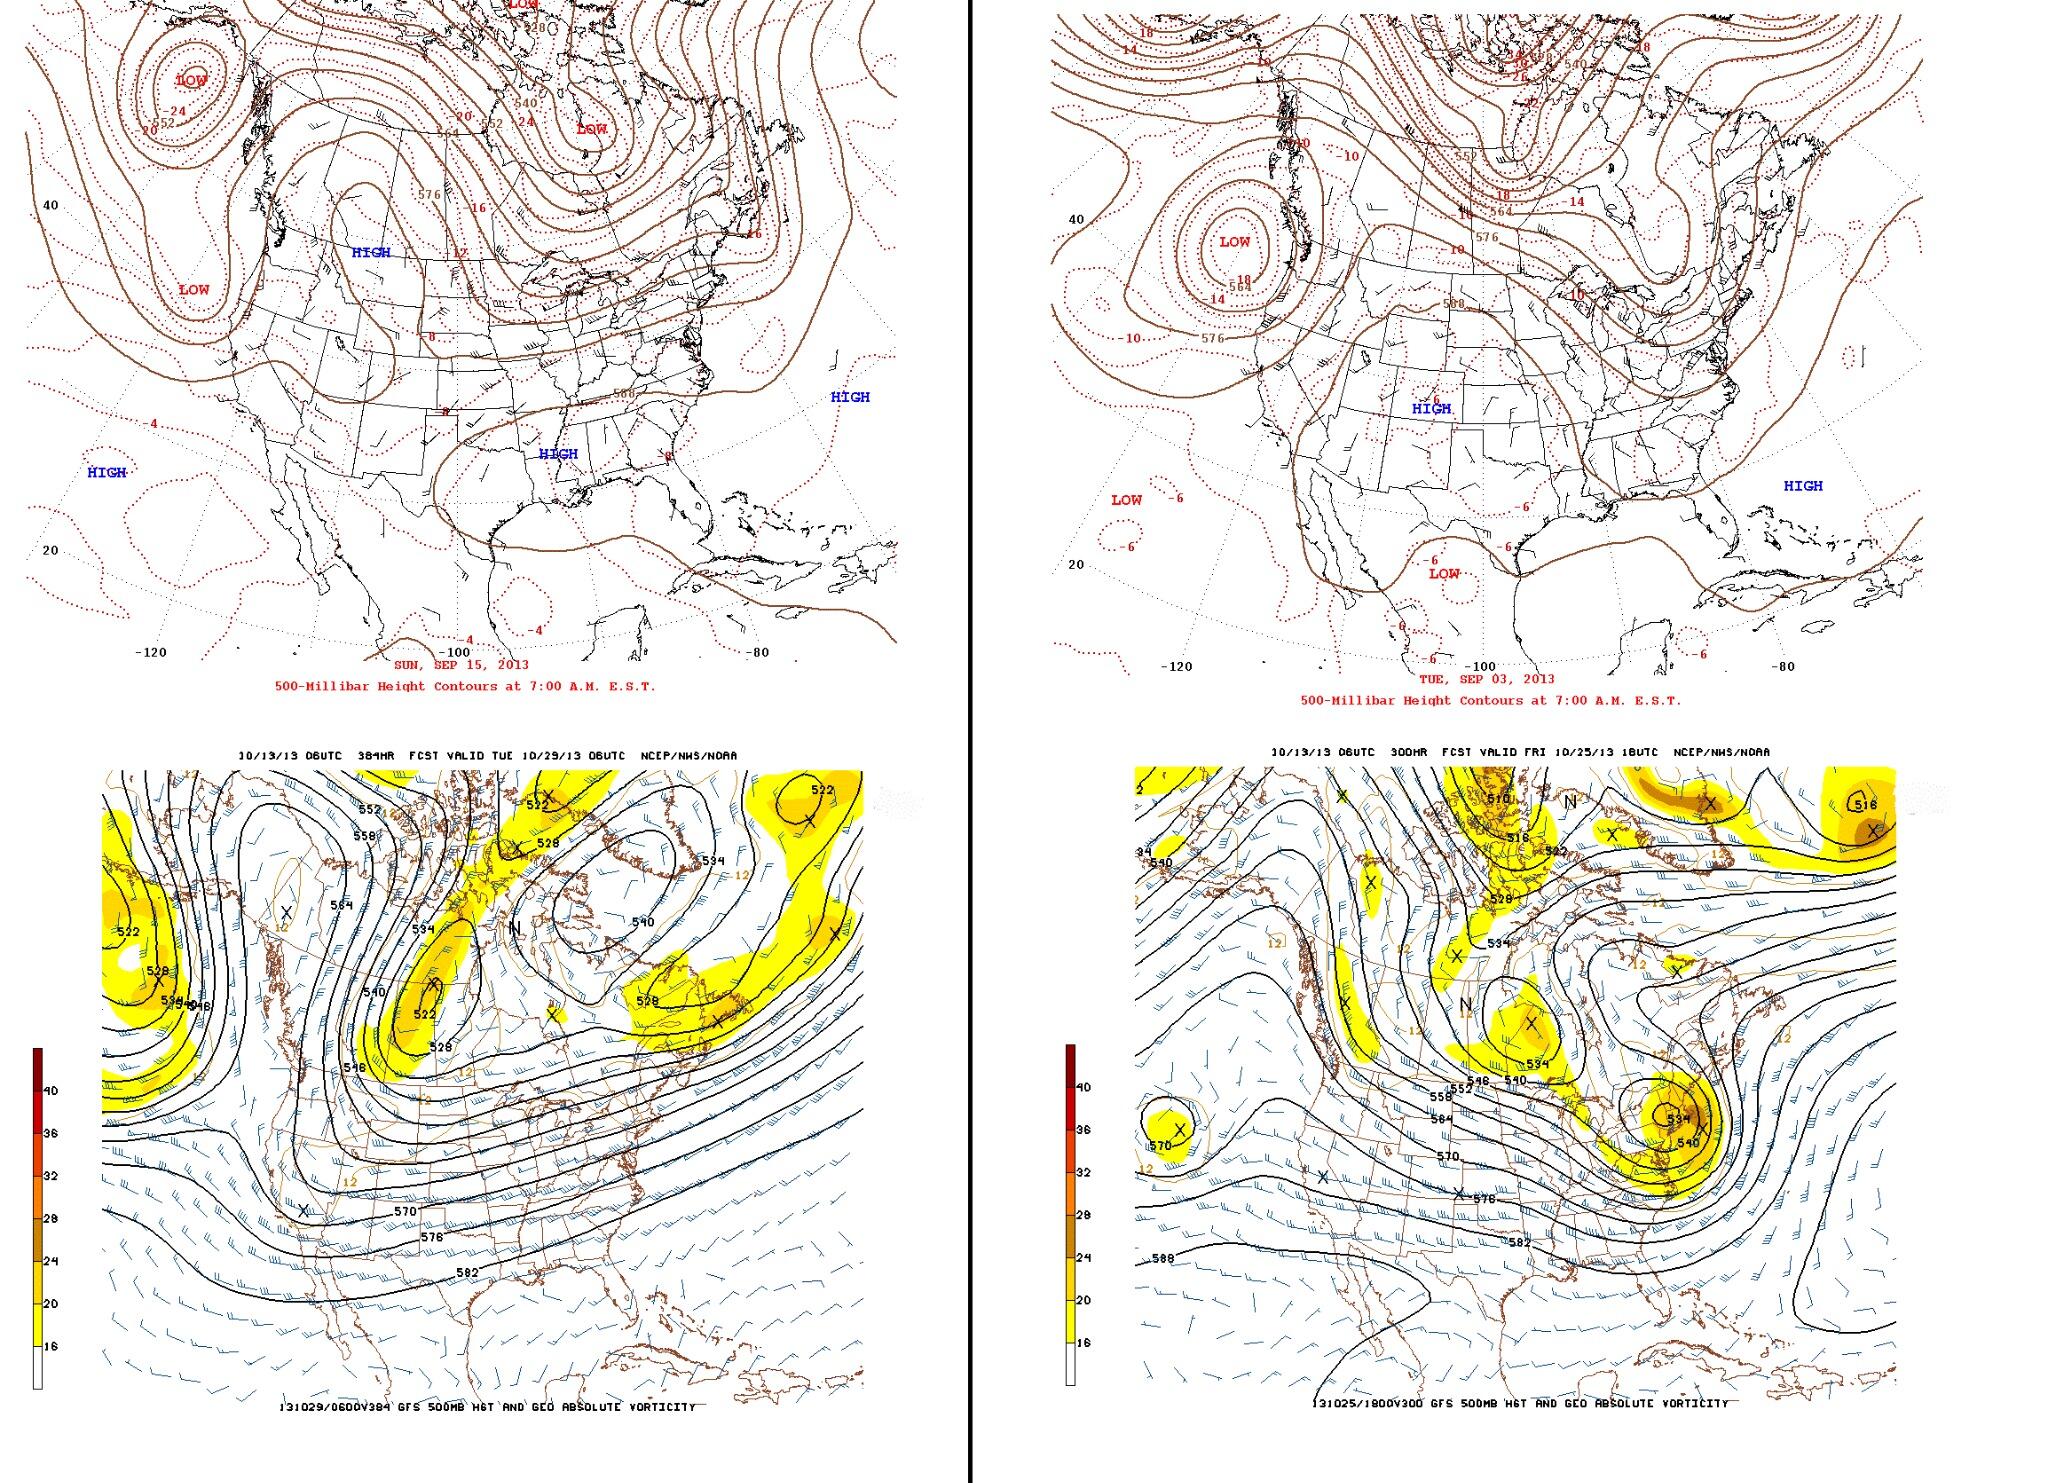
After further analysis I may have had a miscue in my day counting back in May. Never the less. It is summer in the CONUS. The jet is moving pole ward. Looks like there may be an event this time around, but as pointed out way back in January, it's a wimpy Low.

I will likely be posting the 7/7 map, along with storm reports from the forecast below.


----
originally posted May 18, 2013

BUST - I think that H in the four corners held the system from dropping down. A result of the jet stream shifting north? Slowly but surely. No matter, I'm confident that the pattern we are moving into spun several @weatherchannel named storms this winter (grey shade). Will watch this particular pattern (yellow shade) through it's entirety - in early July (5-6) when WI will surely be in the path. LOL.

"Cycle 5" May 13-14, 2013


----
originally posted Apr 28, 2013
Again the time is nearing. How is this pattern going to act this time around? The bet has evolved into an accompanied count of reports from just a warned area. This idea is absurd. Right? I assume I will be laughing at myself in two plus weeks. (For some reason I banked on the cycle coming in at 51 this time around. Seems it may be 52 or 53. My dates need to be extended by a day or two)

A projection - May 13-14, 2013


----
originally posted Mar 25, 2013

The time has passed, I lost the bet. Now we wait until May 13-14 for the next recurrence. How will it act?

"Cycle 4" March 23-24, 2013


----
originally posted Mar 12, 2013

Update: Archived radar loops of this storm from past cycles.

20121016-20 "Cycle 1"
20121208-12 "Cycle 2"
20130129-31 "Cycle 3"

----
originally posted Jan 28, 2013

We may have been a bit cryptic on the AccuWx Forum LRC Thread, so I will attempt to toss all the images into a quick blog entry. Click on each of the images for more information.

"Cycle 1" October 17-18, 2012


"Cycle 2" December 8-9, 2012


"Cycle 3" January 29-30, 2013


This is the pattern I have chosen to wager a "weather future" on. While the future may not be my retirement fund, it very well could be some of the best BBQ I have ever tasted. I am not a severe weather guy, nor have I ever chased, but if I were to pick dates on when I would, it would be March 25-26, 2013 ish. Using a 53 day cycle length I may be a day or two long on my dates. We'll see how it turns out. I've already read some trash talk of my choice; "you will need it to wrap up more next time. Wimpy surface low" - LOL. Be that as it may, I am wishcasting a winner! We will have a very good idea of what it looks like in the Pacific 2.5 - 3 weeks prior to the CONUS version. Stay tuned to the AccuWx Forum LRC Thread.

If there are any questions or thoughts on my research and analysis of the theory or how I presented the material just let me know in the comments section of the blog. Thanks for reading!

Archived Forecast - July/August - WIWX

Having a little fun with the cats over at Wisconsin Weather. I tossed together a remainder of July and all of August forecast for the Facebook Group page.

----
Originally posted on the Wisconsin Weather Facebook page.

Utilizing intraseasonal oscillations and a cycling weather pattern called Lezak's Recurring Cycle the attempt to project weather conditions weeks and months into the future is happening. Currently the data used to generate the forecast are based on a full blend of cycles. The outlook for the remainder of July and all of August, based on the current interpretation of the cycle, is listed below. (http://tiny.cc/isowiwx)


As the jet stream moves pole ward during the summer months a lot of the weather experienced the past 9 months in the Midwest shifts north and the summer anti-cyclone sets in. While this seasonal shift is taking place the patterns are still cycling and WI will continue to feel the effects - on a seasonally affected scale.

Signals are pointing towards temperatures ending below average in July with a rebound to begin August. The end of August looks warm as well. The numbers continue to signal an abundance of precipitation state wide through August. This is true along the borders as well with the only exception being Escanaba, MI. Notable weather events are labeled on the temperature graph in the image by "wisconsinwx" icons along the X axis. I discussed a potential dry spell back in April to take place mid July (http://tiny.cc/wiwx-001), we'll see if that transpires.

Stick with Wisconsin Weather forecasters Justin Poublon and Hunter Anderson for daily forecasts.

Long range forecasts began in April. Past forecasts are below.
June - http://tiny.cc/wiwxjun
May - http://tiny.cc/wiwxmay
April - http://tiny.cc/wiwxapr

More information on LRC and ISO.
LRC - http://osnw3lrc.blogspot.com/
ISO - http://www.cpc.ncep.noaa.gov/products/intraseasonal/

If there are any questions or thoughts on the forecast or the presented material, please leave a comment. Thanks for reading!

Jul 4, 2013

Summer Pattern Trend

Medium range GFS may have the right idea. Pattern trend looks good as of now. Below image is GFS 500 forecast for July 11 accompanied with the OSNW3 Madison MaxT and Pcpn trend.


If there are any questions or thoughts on my research and analysis of the pattern or how I presented the material just let me know in the comments section of the blog. Thanks for reading!

May 31, 2013

Archived Forecast - June - WIWX

Having a little fun with the cats over at Wisconsin Weather. I tossed together a June forecast for the Facebook Group page.

----
Originally posted on the Wisconsin Weather Facebook page.

Utilizing intraseasonal oscillations and a cycling weather pattern called Lezak's Recurring Cycle we attempt to project weather conditions weeks and months into the future. Currently the data used to generate the forecast are based on a full blend of cycles. The outlook for June, based on our current interpretation of the cycle, is listed below. (http://tiny.cc/isowiwx)

•Precipitation will vary from NW to SE. NW below, SE above.
--> An inactive period works in mid month.
•Temps to begin cool, but steadily warm thru the third week.
--> A cool down lasting a couple days to begin the final week.
•Notable storm systems to affect the region;
Around the 7th.
Around the 21st.
Around the 30th.
•We are in progress of creating a three member ensemble that will enhance future long range forecasts. The bottom graph of this image is the high temperature and precipitation chance trend for Oshkosh between June 18 and August 9. More detail can be found by following the link. (http://tiny.cc/koshens - remember to give or take a day, or two)

Stick with Wisconsin Weather forecasters Justin Poublon and Hunter Anderson for daily forecasts.

More information on LRC and ISO.
LRC - http://osnw3lrc.blogspot.com/
ISO - http://www.cpc.ncep.noaa.gov/products/intraseasonal/

If there are any questions or thoughts on the forecast or the presented material, please let us know by leaving a comment. Thanks for reading!


I'll be updating the ensemble forecast periodically as time rolls on. A live image is below. The snap shot is above.


Apr 25, 2013

Archived Forecast - May - WIWX

Having a little fun with the cats over at Wisconsin Weather. I tossed together a May forecast for the Facebook Group page.

----
Originally posted on the Wisconsin Weather Facebook page.

Utilizing intraseasonal oscillations and a cycling weather pattern called Lezak's Recurring Cycle we attempt to project weather conditions weeks and months into the future. Currently the data used to generate the forecast are based on a full blend of cycles. We are in progress of creating a three member ensemble that will enhance future forecasts. The outlook for May, based on our current interpretation of the cycle, is listed below. (http://tiny.cc/isowiwx)

•Multiple precipitation events lead to above average totals.
•Temperature roller coaster ending slightly below average.
•Three notable storms to affect the region;
Around the 13th.
Around the 20th.
Around the 31st.
•Severe weather is probable with the notable storm systems.

Stick with Wisconsin Weather forecasters Justin Poublon and Hunter Anderson for daily forecasts.

More information on LRC and ISO.

LRC - http://osnw3lrc.blogspot.com/
ISO - http://www.cpc.ncep.noaa.gov/products/intraseasonal/

If there are any questions or thoughts on the forecast or the presented material, please let us know by leaving a comment. Thanks for reading!


Mar 25, 2013

Archived Forecast - April - WIWX

Having a little fun with the cats over at Wisconsin Weather. I tossed together an April forecast for the Facebook Group page. Hopefully I'll be allowed to stick around. LOL.

----
Originally posted on the Wisconsin Weather Facebook page.

The traditional etymology of the word April is from the verb aperire, which means "to open". (Wiki) This definition is precise, and correlates well with the month that signifies the beginning of the growing season here in Wisconsin. Average temperatures increase ~15 degrees and daylight hours extend over one hour. These two ingredients, warmth and longer days, encourage the spring growth that shapes our lifestyle.

Utilizing intraseasonal oscillations (ISO) and applying a cycling weather pattern called Lezak's Recurring Cycle (LRC), we attempt to project weather conditions weeks and months into the future. The outlook for April, based on our current interpretation of both, is listed below. (http://tiny.cc/isowiwx)

•Below average precipitation.
•Below average temperatures first half of month.
•Above average temperatures second half of month.
•Two notable storms will take place within the region;
Around the 3rd. (Draco, Orko)*
Around the 10th. (Brutus, Fryer, Plato)*
•The final week should include a steady warm-up followed by a frontal passage providing a sharp cool down to end the month.

The time frame of the second and final week of the month could include severe weather chances just outside the state border. Stick with Wisconsin Weather forecasters Justin Poublon and Hunter Anderson for daily forecasts.

More information on LRC and ISO.
LRC - http://osnw3lrc.blogspot.com/
ISO - http://www.cpc.ncep.noaa.gov/products/intraseasonal/

*These are Weather Channel named storms that have recurred within the particular cycling weather pattern. See the OSNW3|WxClimate LRC calendar - http://tiny.cc/1213cal - for more information on a particular storm.

If there are any questions or thoughts on the forecast or the presented material, please let us know by leaving a comment. Thanks for reading!

Mar 1, 2013

Midwest Snowfall - February and Meteorological Winter Forecast Results

Actual surface data is obtained from the Southern Region Headquarters of the National Weather Service. A handful of stations do not provide complete data from the website above and I am forced to find it manually via other sources. These stations are listed below with their data source.

Oshkosh, WI; WI-WN-4 CoCoRaHS
Ann Arbor, MI; MI-WS-11 CoCoRaHS
Houghton, MI; MI-HG-1 CoCoRaHS
Escanaba, MI; NWS Station GLADSTONE NO 2
Traverse City, MI; NWS station TRAVERSE CITY MUNSON
Champaign, IL; IL-CP-47 CoCoRaHS

February Forecast Snow Results
February Forecast "Snowfall" results
13 out of the 40 stations finished within +/- 30% of forecast total.
February Forecast "Days With Measurable Snowfall" results
17 out of the 40 stations finished within +/- 2 days of forecast total.
----
Met Winter Forecast Snow Results
Met Winter Forecast "Snowfall" results
12 out of the 40 stations finished within +/- 30% of forecast total.
Met Winter Forecast "Days With Measurable Snowfall" results
21 out of the 40 stations finished within +/- 4 days of forecast total.

For more information visit the OSNW3|WxClimate Maps webpage.

If there are any questions or thoughts on my research and analysis of the cycle or how I presented the material just let me know in the comments section of the blog. Thanks for reading!

Feb 12, 2013

My Interpretation of the Recent Patterns - What is Your Take?

Oct 25, 2012

Feb 10, 2013 - 108 ish days from above date (54 average)

The map below, of the specific pattern in the cycle between the cycles mentioned above, may be the odd ball out. Perhaps an interference behavior of a wave? Some science.

Dec 17, 2012 - 53 ish days from Oct 25, 55 ish days from Feb 10.

Below is a graph of the 500mb numbers for a five day stretch encompassing this comparison of each cycle. The blue and green match up pretty well while the red is slightly different.


----

A step further, another map to map. The "cancer", as it has been mentioned, to following the cycle. Was this feature introduced back in the December cycle? No real glimpse of it back in October. Node or antinode?

Dec 19, 2012 - See Calendar

Feb 12, 2013 - 55 ish days from Dec 19.

If there are any questions or thoughts on my research and analysis of the cycle or how I presented the material just let me know in the comments section of the blog. Thanks for reading!