Showing posts with label Recurring Rossby Wave Train. Show all posts

Aug 22, 2018

Harmonic Feedback

Plenty of harmony in the pattern analysis over the past month. Interesting to note the uptick in correlation between RRWT projected and observed 500mb hPa anomaly. Attached is the 46-50d outlook verification. More verification maps here; http://www.consonantchaos.com/a-all.html


If there are any questions, comments, or suggestions on the material presented please let me know. Thank you for reading.

Jul 19, 2018

RRWT Methods Listing

Abstract
The impact of the closely related nature of planetary and synoptic waves is the motivation for this Solution. This Solution attempts to identify periodic upper atmospheric modes that subscribe to repeated weather occurrences.

Introduction
The recurring behavior of observed upper air patterns is reflected as future weather based on the empirical data via statistical modeling. In this pattern correlation phase space, each point represents a possible instantaneous state of the system. A solution of the governing equations is represented by a point traveling along a trajectory in the phase space. A single point in phase space determines the entire future trajectory, providing a composite of potential future weather and climate outcomes. [1]

Background
Studies have attempted to identify recurrent modes that contribute to the alternation between active and inactive periods of subseasonal regimes. Generally, two components of variability were found to be dominant on an intraseasonal time scale: the “short-term” component, with a period of less than 1 month, and the “long-term” component, with a period of 1–2 months but apparently less than a season. Both can be referred to as the intraseasonal oscillations (ISOs) since they are clearly separated from the high-frequency synoptic-scale (less than 10 days) features and the slowly varying seasonal cycle as well. [2]

Methods
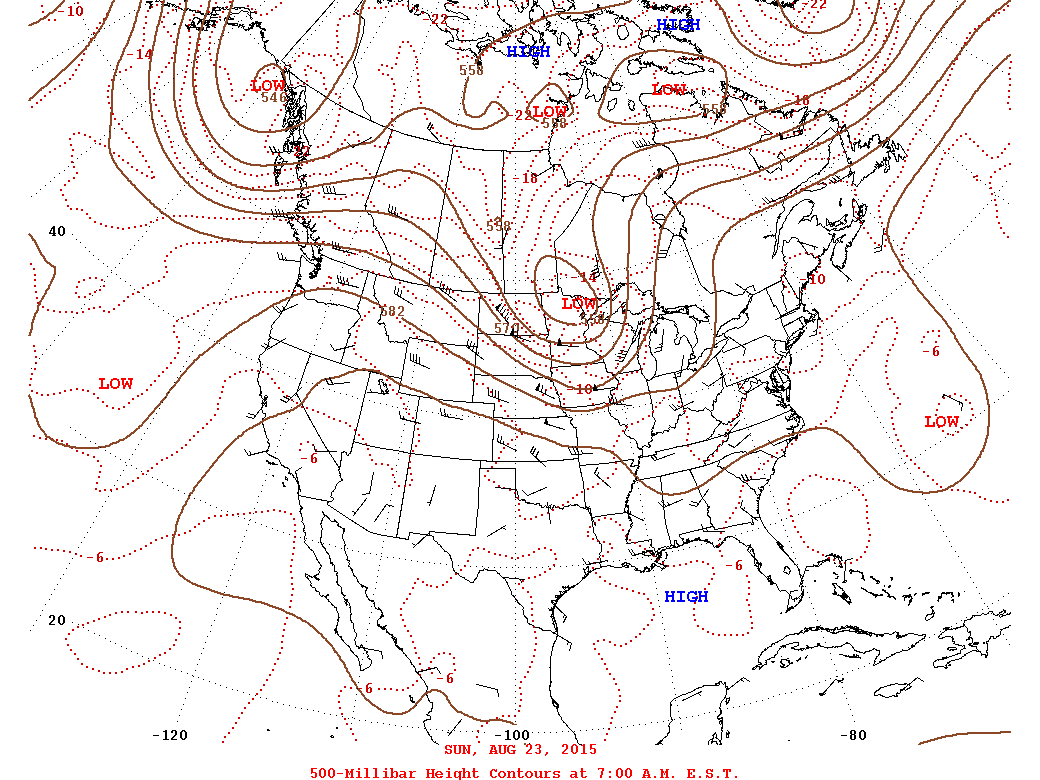
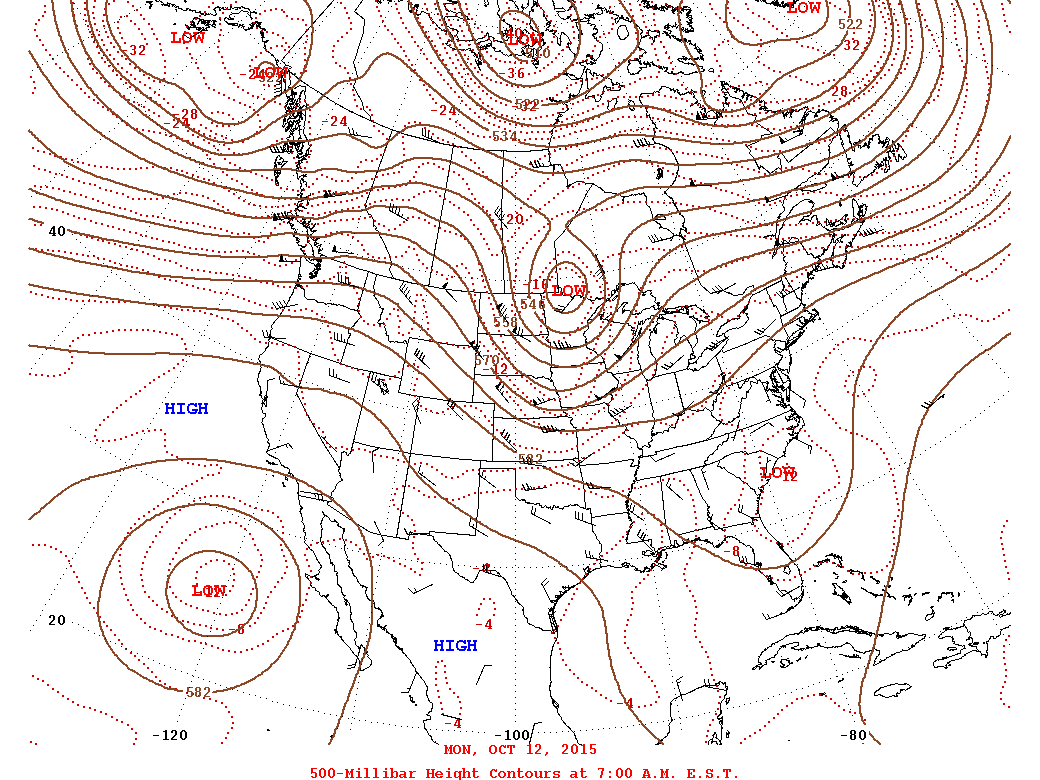
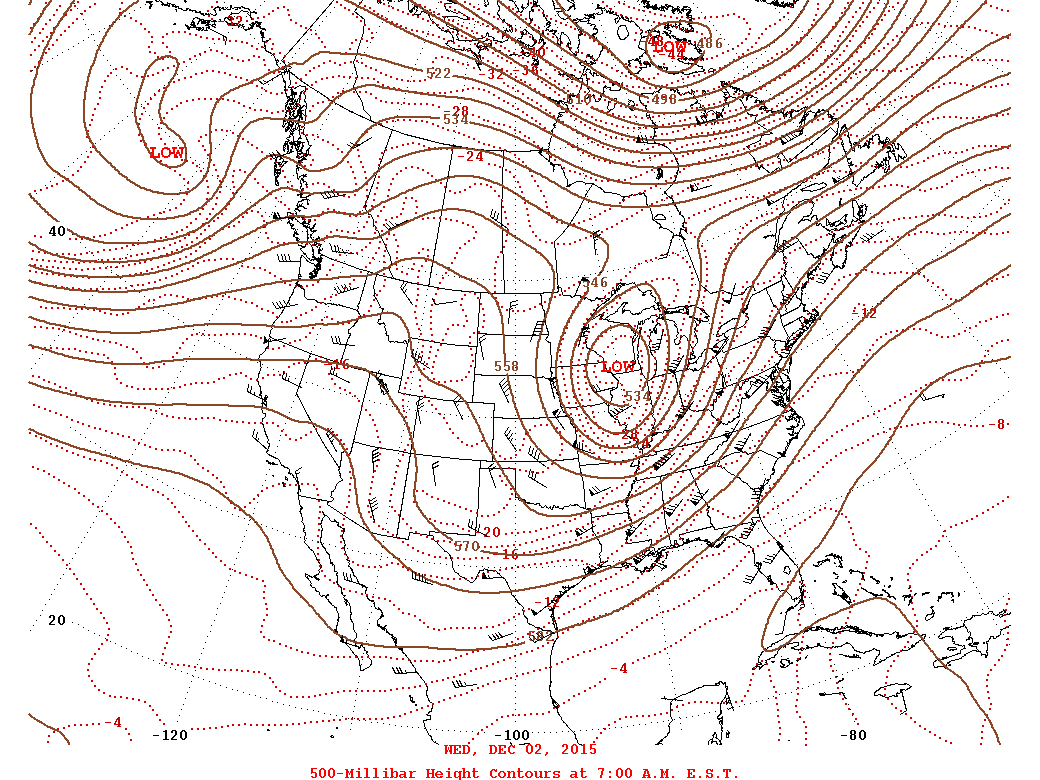
Recurrent modes can be well observed from geopotential height (500 hPa) data. Here the method uses observations of daily 00Z 500mb from 2012 to present with a spatial resolution of 1° latitude from 45N at 10° longitude increments from 0E around the globe. Satellite observations of daily 500 hPa data provided by Navy Operational Global Atmospheric Prediction System (NOGAPS; available online at erdNogaps1D500mb). The dataset has a spatial resolution of 1° latitude 1° longitude with global coverage. [3]

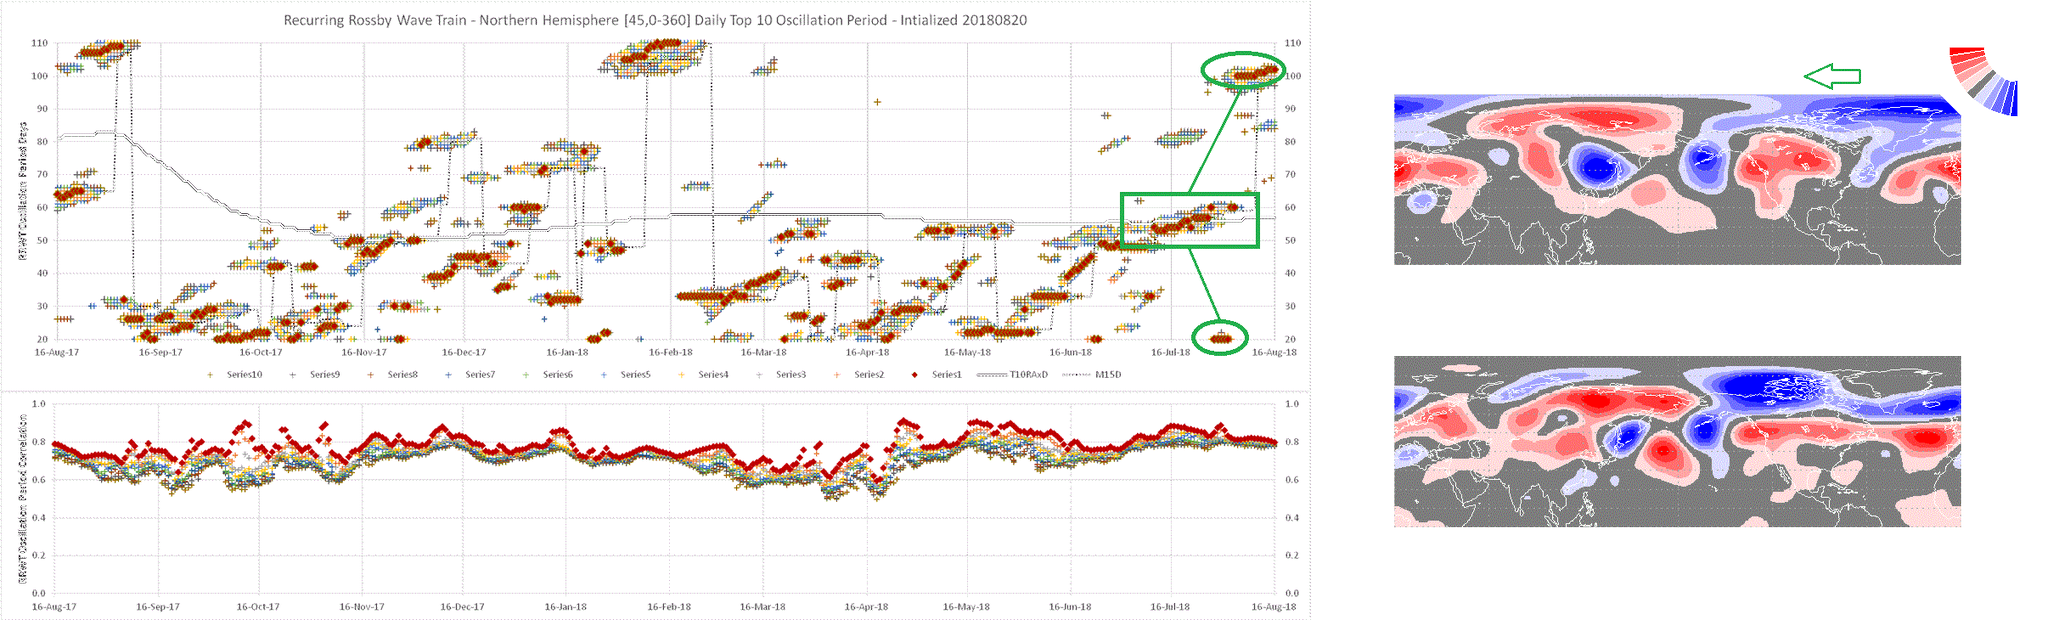
Daily frequencies are obtained by correlating “current” patterns with “previous” patterns at lengths of 20 to 110 days for seven ~50° longitudinal wide regions. These correlation data are then reconstructed with respect to a daily top 10 for any calendar year. These daily top 10 correlations then construct a daily running average for the given calendar year (GAxA).

With the above criteria a global daily top 10 is constructed from each of the seven regions. These top 10 are then constructed into a daily running average for the given calendar year and a 15 day mode from present (M15D). Along with these frequencies, a daily average of the regional running averages is also constructed (RAxD). To overcome an evident intraseasonal jet position bias the method also seeks the top correlated frequency interval from the previous 720 days based from the present RAxD frequency (BeOP).

These frequencies (GAxA, M15D, RAxD, BeOP) are then used to seek analogs of observed wave trains and extend the encompassing weather from the present day. Deriving analog dates is accomplished by adding the forecast range to the present day then subtracting the interval rate. A three and four week forecast generated on 3/26 would provide a forecast for 4/10-23. Using an interval rate of 39, for example, would provide analog dates of 3/2-15.

Results
A time table displaying daily top 10 pattern correlation shows consistent features within the results. High correlated patterns centered on the 30-60 day period with top correlation greater than a 0.70 coefficient. Some interesting features are found with the time table as well. The highest coefficients form harmonious modulation of a seasonal standing wave. In addition, the 30-60 day interval displays moderate flux in correlation power with biannual dips centered on the equinox. During this time a lower frequency, interval greater than 60 days, over powers the 30-60 day interval. Also observed are periods when higher frequency, lower than a 30 day interval, are the only active intervals. [Figure 1]

Conclusions
Planetary friction and blocking will cause temporal and spatial difference in sensible weather returns. These challenges continue to advocate trial and error experiments within the framework. One theorized action incorporated a high correlated synoptic wave of 10-20 days to aid in sudden wave change. This idea proved too delicate in long range projection as it relied heavily on persistence. Another theorized action extended beyond the intraseasonal timescale and sought correlation of the average interval rate within the past two annual cycles. This idea proved robust in long range projection as it maintained a long-term longwave with seasonal sensibility.

Improvements to the framework correlation domain are desired, such as greater data points, finer grid resolution, and able mathematics. Utilization of the recurrent nature of the atmosphere can provide insight to future waveguides. The novelty of this approach is the ability to anticipate long range patterns based on recently observed patterns.

References
1. Xubin Zeng, Roger A. Pielke and R. Eykholt. Chaos Theory and Its Application to the Atmosphere. Department of Atmospheric Science, Colorado State University, Fort Collins, Colorado. 1993;74:631-44. [Bulletin of the American Meteorological Society]

2. Bin Guan and Johnny C. L. Chan. Nonstationarity of the Intraseasonal Oscillations Associated with the Western North Pacific Summer Monsoon. Laboratory for Atmospheric Research, Department of Physics and Materials Science, City University of Hong Kong, Hong Kong, China. 2006;19:622-28. [Bulletin of the American Meteorological Society]

3. NOGAPS 500mb data. Prior 2012 500mb data were gathered from NOAA/ESRL Radiosonde Database available online at https://ruc.noaa.gov/raobs/.
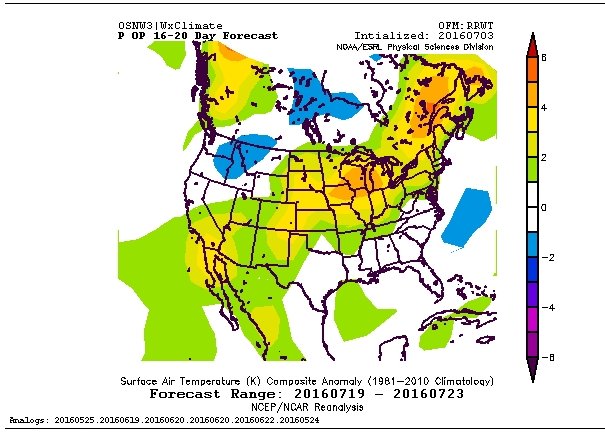
Figure 1

Jun 7, 2018

RRWT Forecast Verification

Slowly automating RRWT forecast verification. Utilizing GrADS scorr function at the moment. Unsure hemispheric spatial correlation is the best path, but I find it entertaining that generating a forecast verification is considerably more intensive than generating a forecast.


Experimenting with the verification strategy and metrics. Attempting to verify each of the current outlooks.


Scores located here: https://www.consonantchaos.com/a-all.html

For those interested in the verification method, it is a quite simple. The verification data are generated from ESRL NetCDF files utilizing the scorr function within GrADS. If there are any questions, comments, or suggestions on the material presented please let me know. Thank you for reading.

Jun 1, 2018

2018 Indian Summer Monsoon

14 of the 31 May RRWT precipitation rate outlooks for June, July, and August are suggesting a potential deficit in Indian rainfall compared to the average of the past 10 years.


8 of the 31 are suggesting similar accumulations of the past 10 years.


If there are any questions, comments, or suggestions on the material presented please let me know. Thank you for reading.

Jan 23, 2018

RRWT Correlation Wave(s)

The Pacific Ocean has been dominating recently.


If there are any questions, comments, or suggestions on the material presented please let me know. Thank you for reading.

Jan 8, 2018

Harmonic Phase

An example of the Recurring Rossby Wave Train correlation waves phasing in and out of a harmonic pattern. The 31-35 day outlook from 12/27/17 vs the 21-25 day outlook from 1/6/18. The micro change is quite noticeable while the macro, overall global pattern, is for the most part still intact.


If there are any questions, comments, or suggestions on the material presented please let me know. Thank you for reading.

May 19, 2017

Strange Attractor

In the Recurring Rossby Wave Train pattern correlation phase space, each point represents a possible instantaneous state of the system. See image below.


(source)

A solution of the governing equations is represented by a point traveling along a trajectory in the phase space. A single point in phase space determines the entire future trajectory, providing a composite of potential future weather and climate outcomes. See image below.


(source)

For more information on chaotic quantity, please visit the linked paper (Zeng et al 1993). If there are any questions, comments, or suggestions on the material presented please let me know. Thank you for reading.

Jul 4, 2016

Wisconsin Nearly a Bullseye the Third Week of July with +2mT Anomaly

Wisconsin nearly a bullseye the third week of July with +2mT anomaly.

Analog composite per Recurring Rossby Wave Train (RRWT).

(source)

H5 Low/High placement of analog dates from composite.

(source)

If there are any questions, comments, or suggestions on the material presented please let me know.

Jan 30, 2016

Testing: Severe Weather Pattern Projection Based on the Recurring Rossby Wave Train, Bering Sea Rule, and Typhoon Rule

We generated a small time sample of potential Spring severe weather pattern based on the Recurring Rossby Wave Train, Bering Sea Rule, and Typhoon Rule, also know as the Organic Forecasting technique called the "trifecta". To simplify the write-up the RRWT hindsight dates are linked to their corresponding H5 map. For the daily SPC storm reports go here and change the date in the url. The projection dates are listed below the chart and are bolded.

The chart below shows the regional RRWT oscillation period average. The oscillation period average is used to project the initial future date that is expected to hold similar weather pattern ingredients as previous oscillation period weather patterns, +/- 3 days. The projections will be maintained once the projection date is ~30 days from realization. Methods used to confirm original projection will consist of modeled BSR(~30 days), current RRWT oscillation period(~30 days), observed BSR(~20 days), modeled TR(~16 days), observed TR(~8 days), and GFS/GEM/EURO model guidance(~3 days).


Hindsight dates
09/08-11/05-12/23
09/18-11/11-12/30
09/27-11/16-01/09

Foresight dates using OP of 52 days
12/23-02/13-04/05-05/27 (Ref)
12/30-02/20-04/12-06/03 (Ref)
01/09-03/01-04/22-06/13 (Ref)

If there are any questions, comments, or suggestions on the material presented please let me know.

Jan 22, 2016

The Intraseasonal Oscillation Evolution of Jonas Based on the 30-90 Day Average Oscillation Frequency

The Intraseasonal Oscillation evolution of #Jonas based on the 30-90 day average oscillation frequency.


+/- 3 Days


If there are any questions, comments, or suggestions on the material presented please let me know.

Jan 10, 2016

Daily Analysis of the Recurring Rossby Wave Train

RRWT analysis suggests the Four Corners are closest to the long-term longwave in 2015-16. Click image for larger view. More charts here


I had a feeling it was going to look a bit ominous when DEC came calling again. RRWT 21-25 Day 2TM anomaly. Odds of this happening? Click image for larger view. More maps here.


If there are any questions, comments, or suggestions on the material presented please let me know.

Dec 26, 2015

Station Trends Based on the RRWT Average Correlation Wavelength

I added a new test specimen. I want to compare the group velocity wavelength method versus the average wavelength method. In order to do so I needed data and decided to implement the average wavelength method into a Station Trend output like I currently have for the group velocity method. The forecast data for the average wavelength method can be found here. I will be conducting verification on both methods. On a side note, the average wavelength method acts as a numerical genesis for the Lezak Recurring Cycle and the Doug Heady Pattern cycle length. This means anyone can forecast like Gary or Doug as the LRC/HP cycle length is automatically generated on a daily basis, all year round. If there are any questions, comments, or suggestions on the material presented please let me know.

Dec 11, 2015

The Evolution of the Daily Trend - Suggested Weather Pattern to Begin 2016

In early September I Tweeted the January 2016 Daily Trends for Wausau, Milwaukee, Madison, and Oshkosh.


The Daily Trends showed a time period of below average temperatures for all locations to begin the new year. Since that day, the CONUS weather pattern correlation envelope has evolved daily. This group velocity is monitored in standing wave notation, so I would expect that the Daily Trends wouldn't change all that much.

With the Bering Sea Rule showing a storm to impact the ECONUS, I felt it time worthy to look at what the Daily Trends currently have in store for the new year.


The Daily Trends model run of 12/10 shows a similar pattern response but the temperature amplitude from average is less dramatic. The overall idea now is that temps will remain at or above average, instead of 5 to 7 degrees below average. We shall see!

In regard to the storm, below are possible Recurring Rossby Wave Train systems, based on current individual correlation waves of ~70 and ~50 days. If there are any questions, comments, or suggestions on the material presented please let me know. Click on the images for a larger view. Thanks for reading!

Dec 7, 2015

WARNING: #Christmas #Weather


Click the forum link in the Tweet above. It will provide a 15 second read of what I was thinking with the posted images. If there are any questions, comments, or suggestions on the material presented please let me know.

Nov 11, 2015

Seasonal Variation of a Signature Rossby Wave Train


Above is a Tweet designating dates of previously high correlated patterns for the storm occurring in the middle of the CONUS on 11/11/15.
(US Radar Loop). The image below depicts the correlation frequencies of the recurring RWT and focuses on the significant disturbance. Click on the image for a larger view. (bigger yet)

If there are any questions, comments, or suggestions on the material presented please let me know. Click on the images for a larger view. Thanks for reading!

Nov 10, 2015

Western Great Lakes Region 2015-16 Winter Forecast Snapshot (DJFM)

The Framework: Utilize NOAA/ESRL Radiosonde Database to analyze large-scale upper atmosphere patterns in standing wave notation. Described specifically to harmonics, reflecting the temporal/transient behavior of the frequency wavelengths in correlation and relating Intraseasonal Oscillation to Mid-Latitude recurring weather patterns. The Goal: Forecast skill of upper-air and surface weather trends. The Test: Recurring Rossby Wave Train.

As of November 10, 2015 two dominant frequencies of correlation are identifiable. A low 30 and mid 40 day wavelength. Simply put, my model projects based on the weather pattern correlation standing wave behavior. Forecasts and analyses of this behavior can be found here. If more indepth information is desired I often Tweet and post on the AccuWx Forums.

Western Great Lakes Region 2015-16 Winter Forecast Snapshot (DJFM)
If there are any questions, comments, or suggestions on the material presented please let me know. Click on the images for a larger view. Thanks for reading!


Oct 22, 2015

The OSNW3|WxClimate Correlation Wave Fundamental Frequency, Harmony, and Phase Change

For a while now I have been connecting the weather pattern recurrence correlation to a standing wave formation. In the heatmaps and charts below I can see fundamental frequency, harmony, and phase change. The transient behavior of the frequency wavelengths is also evident when using them to project the weather pattern as shown by a recent timeline of forecast output.


If there are any questions, comments, or suggestions on the material presented please let me know. Click on the images for a larger view. Thanks for reading!

Oct 13, 2015

A Quick Ramble. An Example of Pattern Correlation.

What do I mean when I mention pattern correlation? The chart below shows the H5 for Oakland, CA and the linear connection of two cycles. Top frequencies in the region have hovered in the mid 50s for nearly a month. Oct-12 top frequency for Oakland, CA was 54 days, the correlation result was 0.63.


The H5 values are not supposed to match, but instead parallel each other. If there are any questions, comments, or suggestions on the material presented please let me know. Click on the images for a larger view. Thanks for reading!

Oct 9, 2015

A Modeled H5 Sub 520 in the Bering Sea at Forecast Hour 144

I am anxious to see what the RRWT model comes up with. The time frame will be coming into focus with the 21-25 day very soon.

ECMWF 500mb 144


Recurring Rossby Wave Train Frequency


~37 Days Ago


~54 Days Ago


Either way, this BSR moment caught my eye. Did a touch of quick research and this is what I came up with. Sniff it out, deets come later.


If there are any questions, comments, or suggestions on the material presented please let me know. Click on the images for a larger view. Thanks for reading!

Sep 7, 2015

Testing of the Recurring Rossby Wave Train Continues

The 2015-16 website is located here. I've scaled down the amount of station trends I provide on the website. I sort of upped the ante with forecasts utilizing ESRL mapping techniques. I have partnered with some others to use their frequency and run it through my framework and push the results back to them. I am providing plenty of pattern correlation analysis as well. It's still fun I guess. If there are any questions or concerns about any of the material please leave a comment or email me.

I have provided links to the evolution of this farcical process. Each year it evolves, and I am looking forward to what I learn this year.

2014-15
2013-14
2012-13
2011-12
2010-11