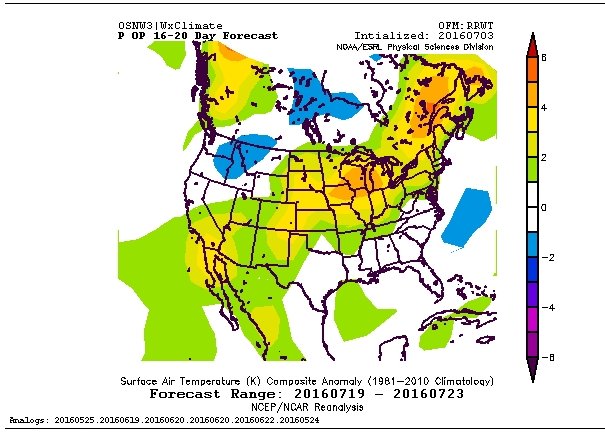
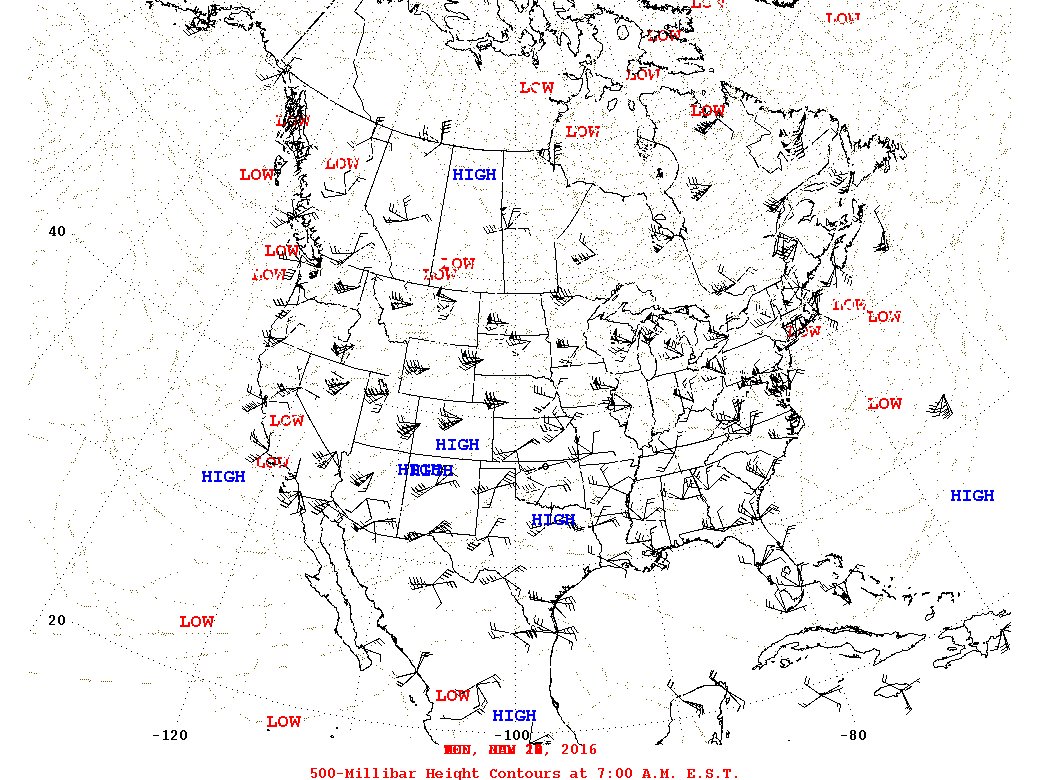
We generated a small time sample of potential Spring severe weather pattern based on the
Recurring Rossby Wave Train,
Bering Sea Rule, and Typhoon Rule, also know as the Organic Forecasting technique called the "trifecta". To simplify the write-up the RRWT hindsight dates are linked to their corresponding H5 map. For the daily SPC storm reports go
here and change the date in the url. The projection dates are listed below the chart and are
bolded.
The chart below shows the regional RRWT oscillation period average. The oscillation period average is used to project the initial future date that is expected to hold similar weather pattern ingredients as previous oscillation period weather patterns, +/- 3 days. The projections will be maintained once the projection date is ~30 days from realization. Methods used to confirm original projection will consist of modeled BSR(~30 days), current RRWT oscillation period(~30 days), observed BSR(~20 days), modeled TR(~16 days), observed TR(~8 days), and GFS/GEM/EURO model guidance(~3 days).

Hindsight dates
09/08-
11/05-
12/23
09/18-
11/11-
12/30
09/27-
11/16-
01/09
Foresight dates using OP of 52 days
12/23-
02/13-
04/05-
05/27 (
Ref)
12/30-
02/20-
04/12-
06/03 (
Ref)
01/09-
03/01-
04/22-
06/13 (
Ref)
If there are any questions, comments, or suggestions on the material presented please let me know.

